Are you one of those paranoid people who is terrified that an insane calamity is just around the corner? Are you obsessively checking the world news waiting for the moment that you can spring into action? Well, why not harness that obsessiveness, be productive at the same time and check out if your country’s power system is about to come crashing down. Here I’ll show you a little bit of Python coding and analysis I did to discover some information about Taiwan’s Power Grid. Find out what I discovered and how below. TL;DR: You’ll be relieved to know the lights are still on in Taiwan …. yes …. indeed ….. sigh … who am I kidding. None of you are actually reading any of this text are you? … why don’t I just show you the pretty pictures and colorful code? Boys and girls, take out your crayons.
My Goals
Essentially I want to understand a bit more about what the Taiwan Power Grid looks like. To do this I’m going to essentially start by building a standard skeleton file in Python to extract this data from Taiwan’s openly published data. The process will involve a few key steps as shown:
- Opening and looking inside ZIP File data package
- Extracting relevant time period data files from the ZIP file
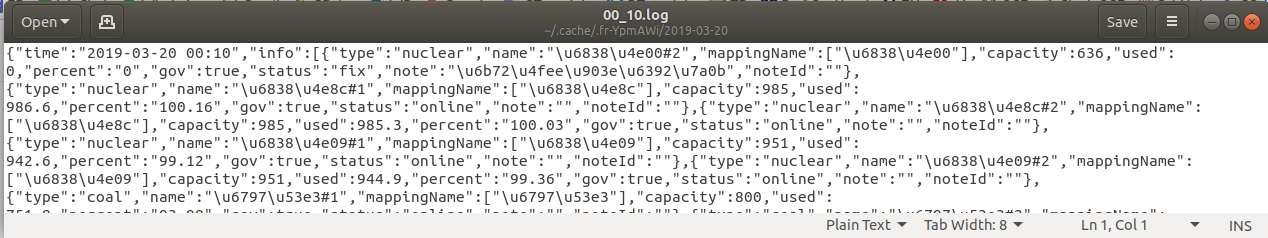
- Reading the JSON data structures inside the selected files
- Collecting and aggregating the data from these data structures
- Doing some very simple calculations on the data
- Doing a very simple visualization of the data & talking about some of the implications
But before we get to all of that let’s setup the python environment. This is only for newbies or people who have spent so long programming in other languages that they’ve gotten terribly rusty with python (a.k.a. me right now).
Setting Up Python Environment
Basically, the first step is to setup Python. I used python eons ago and so I need to do a bit of re-learning. So those of you who are beginners or like me, this section is for you! The rest of you can skip on to the next section.
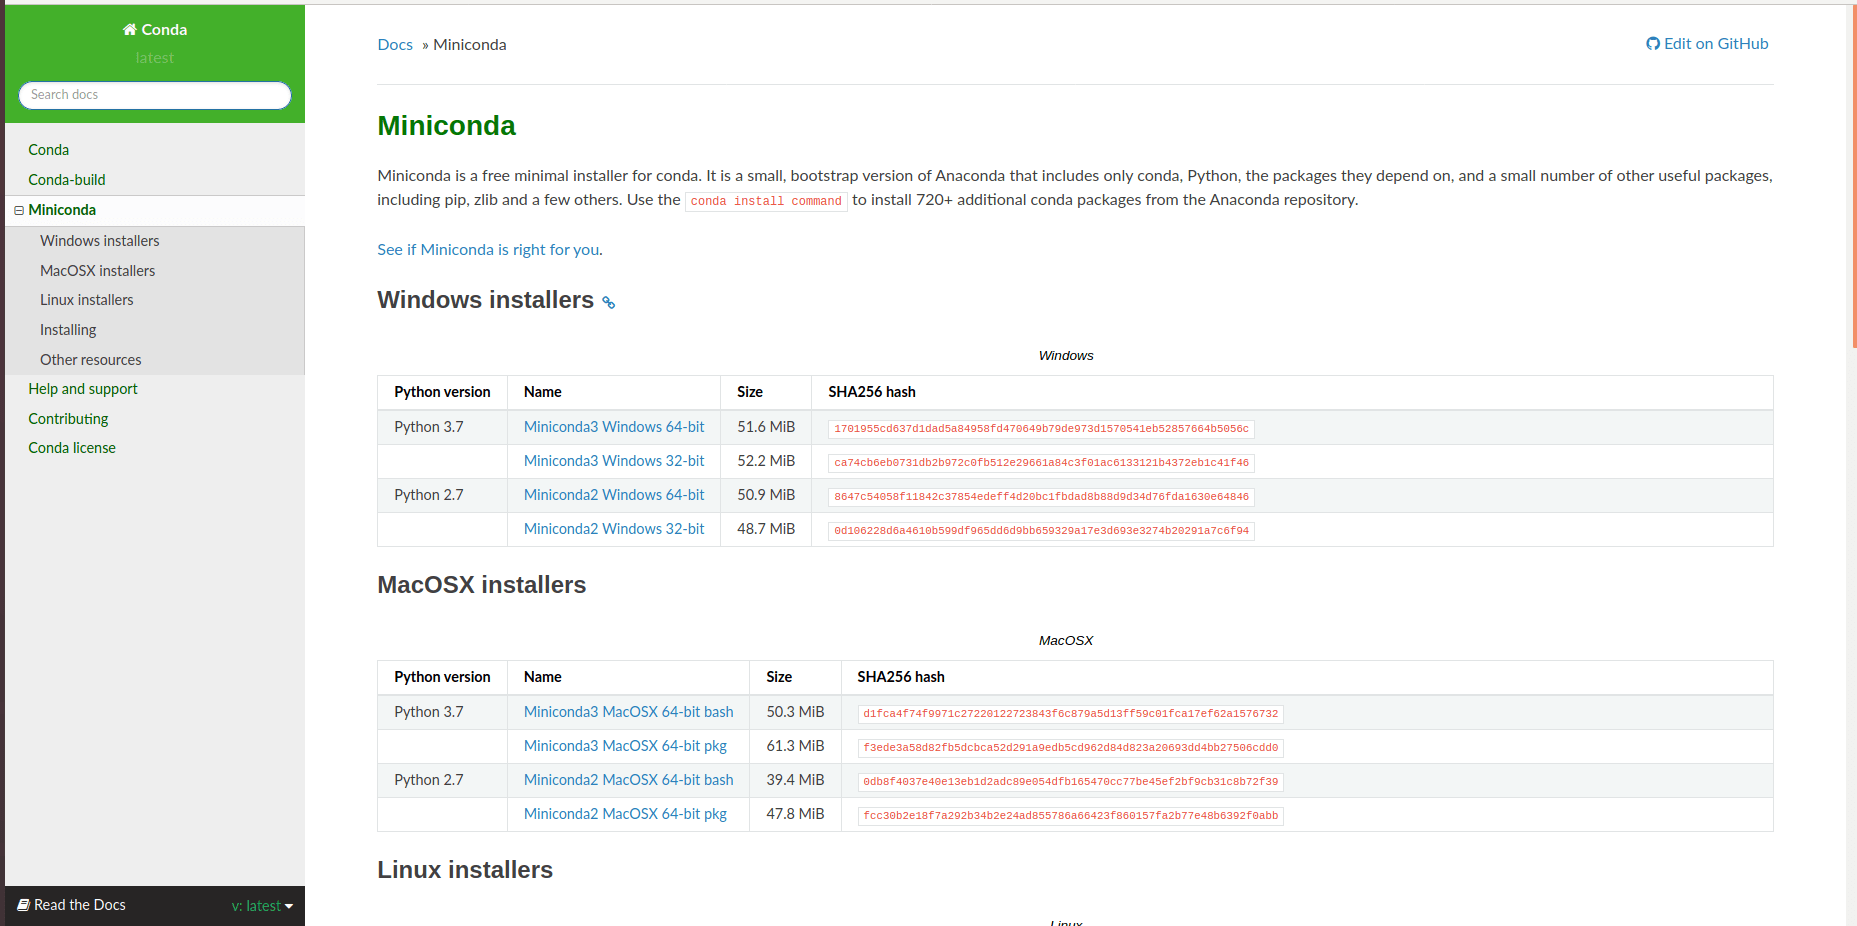
- Install Anaconda or Miniconda. Both of these are essentially package managers. And you use them to install add-ons or upgrades to your Python environment as you need. I’ll be using Anaconda.

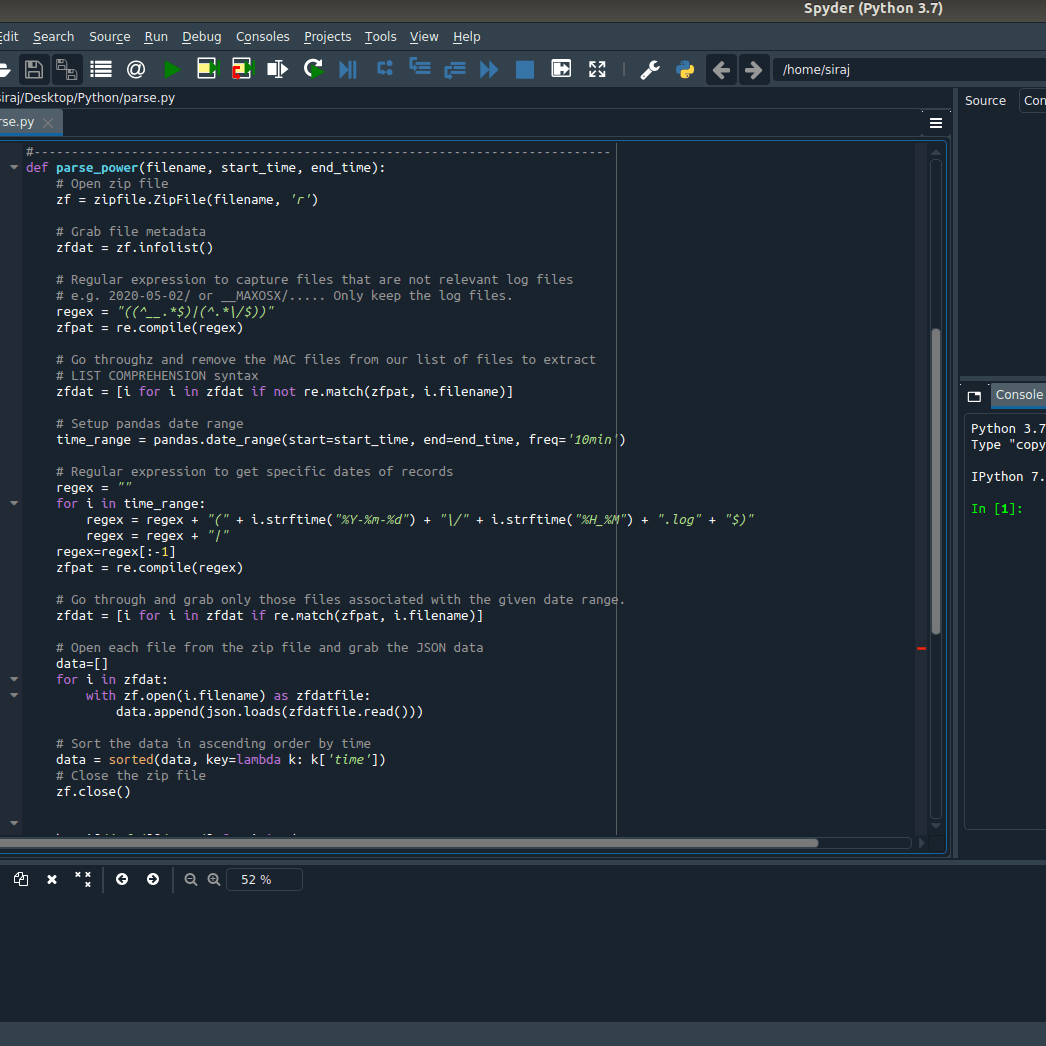
- At this stage we have a choice between IDEs: PyCharm, Jupyter or Spyder. I ended up choosing Spyder. I found PyCharm to be clunky and difficult to use for such a simple project. It seems to be geared more towards large software projects. Avoid it if you are just getting started as its hopelessly confusing for a beginner. Jupyter is an online editor and IDE. Spyder is offline, very easy to use and has something of the look and feel of MATLAB as well in the way you can browse variables, use the console and program at the same time.
- Now as a point of reference. We will need to use some documentation while programming. You can directly use the Python documentation as linked below.
Power Data Sources
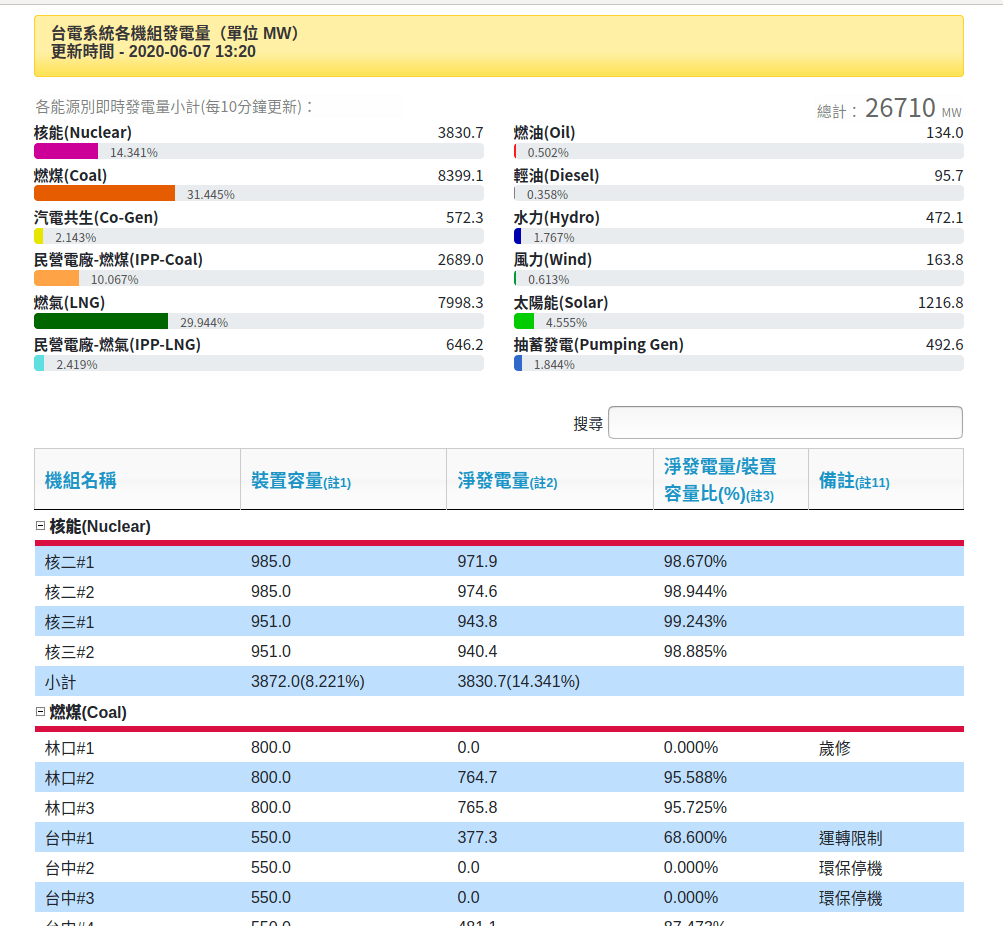
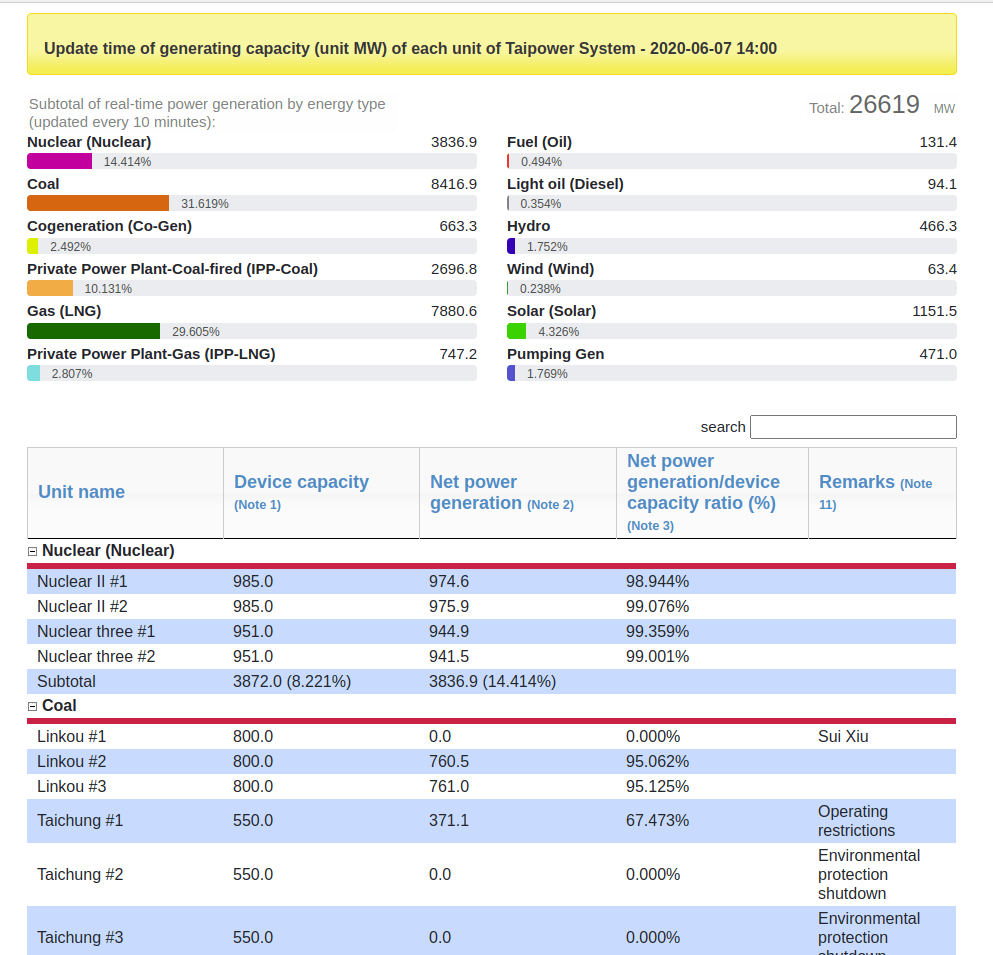
For my particular reference case, I’m going to start by looking at the data from Taiwan. In Taiwan, the Taiwan Power Company (a.k.a. TPC or Taipower) provides open licensed publicly available data via their web portal in live format. Further they also provide packaged offline data on their various government portals that could be useful in understanding power dynamics of the Taiwan National Grid. Click on the buttons below to see some of this data. Be warned its in Traditional Chinese so you’ll need to do some translating if you don’t understand.
WORLD DATA SOURCES (Not an Exhaustive list!)
There is an array of power systems related data available for countries around the world online, but it remains quite fractured. For now I want to quickly point you out to a few of these data sources. The first is the Open Power System Data project which is a European project aimed at collecting data for energy system models. Another is the European Network of Transmission System Operators for Electricity (ENTSO-E) which provides a beautiful set of data visualization tools for multiple countries across Europe using their transparency platform. If you are interested in the UK specifically, the UK National Grid ESO provides some data as well via their data portal. For additional high level world data you can also check out the Global Energy Observatory, Enerdata Global Energy Statistical Yearbook, British Petroleum’s Statistical Review of World Energy and Our World in Data (Energy) aggregated datasets. There are also independent people who have packaged missing data from Taiwan and other countries into convenient ZIP files – one of these is the data I’ll be using for analysis.
There are different formats of data available to us. Ultimately, my goal is to extract the data from the Taipower live data portal directly but for now I’ve found a packaged archive of a little bit of data online. The format of this data is a ZIP archive containing folders with JSON data. Ultimately, though, data might be available in many different formats as listed below:
- ZIP Archive
- JSON Data
- SQLLITE Database
- XLSX Microsoft Excel Data
- CSV Comma Separated Value Data
The data may also have separate meta-data descriptors to explain its format and usage. For my purposes this is not the case and most meta-data is embedded in the file itself. So to understand the format requires some peaking into the file format directly. In addition looking at the Taipower Live Data website can be useful for extracting some additional meta-data (e.g. for units). I’ve provided some screenshots below in-case the website is no longer available at the time of reading this blog.
Basic Skeleton Code
The first step in the process is building my basic Python file skeleton code structure. The way I do this is to create a Main section that runs first and a few functions for operating on the data in steps. So I have the following:
- A main function
- A function for reading the zip file data
- A function for reformatting this data for future searching
- A function for doing some calculations and searching within this data
- A function that can use the data for visualization
Reading ZIP File & Regex
Now we are ready to fill out the skeleton code. Let’s start by examining the ZIP file we have available. I have a relatively small file with only a few days worth of data in it. You can download this tiny dataset directly from TPC website or by scrolling down to the conclusion section of this article.
The easiest way to examine the file is just by using your file manager and viewing it with an appropriate extraction program. As shown below:
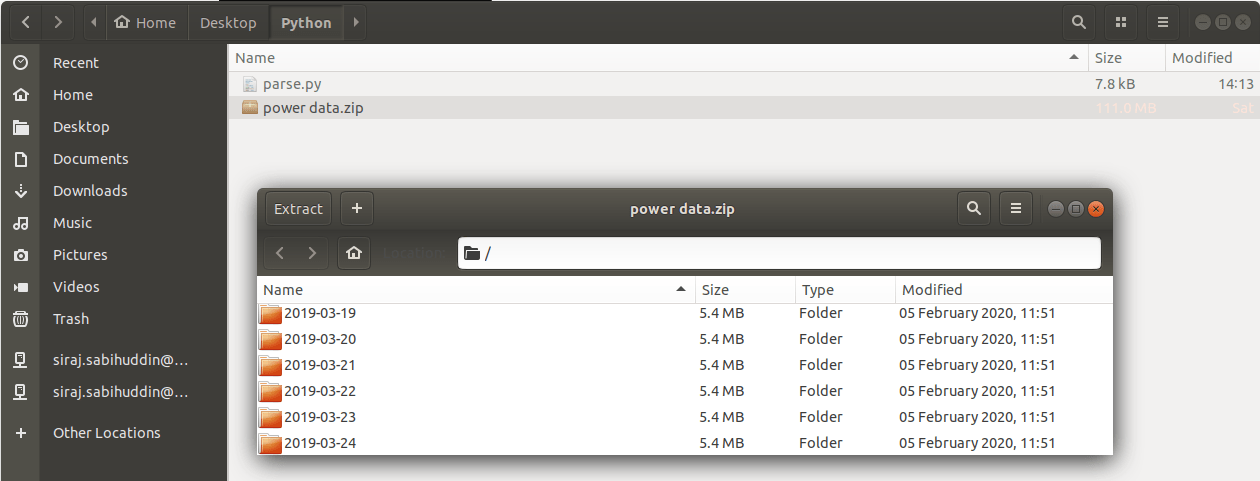
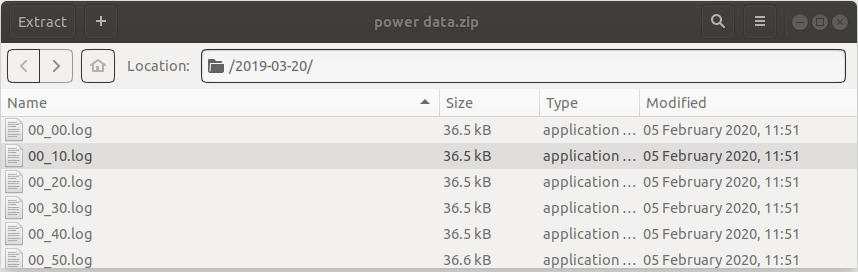
Given this structure we can get a sense of how to extract data. First, we build a path to the folder containing the zip file using the OS library (os). This ensures that there are no OS related compatibility issues with the paths to the file. In my case the path to the data file is the same as the python file. We also need the library for extracting zipfiles as well (zipfile). The code below also creates the path for the filename of the ZIP file and calls the main function to extract the ZIP file data. The time range is formatted as a list of string date values formatted as “yyyy-mm-dd-hh:mm:ss”. Likewise, the power_plant variable provides a list of different kinds of power plants for which to grab the data.
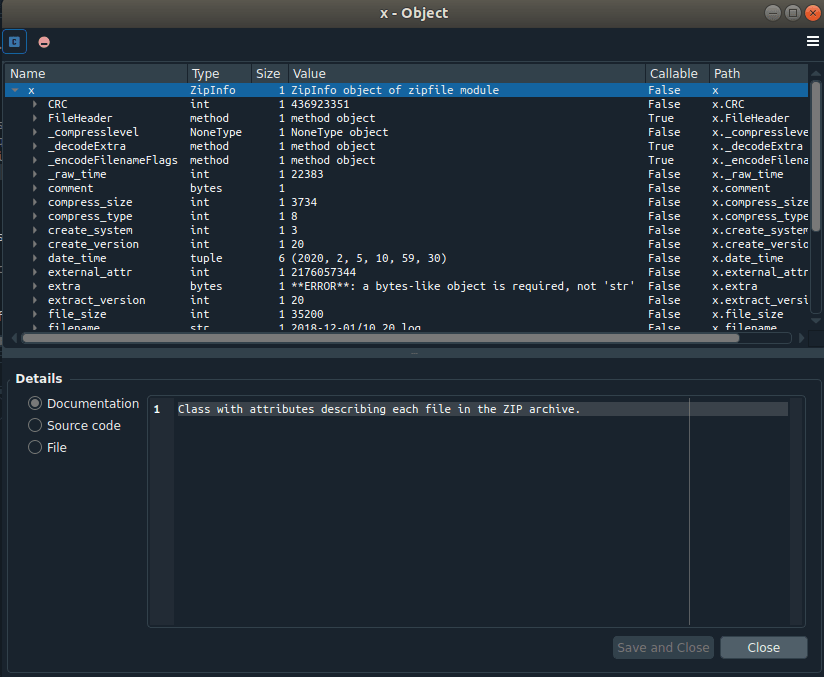
From here we can build the extract function first to open the ZIP file (using zipfile.ZipFile(…)) and then grab info about its contents (using zf.infolist()).
Looking inside the info list for the ZIP file we see the following format. Here the filename variable is most important.
There is a little problem with the folders/filenames in the ZIP file. There are some temporary files in the folder as a result of MACOSX that must be ignored. One way to do this is to make use of regular expressions (regex). See below.
Once the regular expression is constructed, we want to use a LIST Comprehension to iterate through and only grab the data that is not one of the irrelevant files or folders. That is we are looking to exclude all folders that match the regex. From here we can go on and start opening the log files stored in the ZIP file that match our particular time range of interest.
Notice that the regular expressions that need to be constructed to extract the correct log files is somewhat more complex. This regular expression involves finding the correct data format matching the time range passed via the main function to the extract function. Here for every time value in the time range we will check and find the matching JSON log file. You can make use of an online tester for regular expressions in order to verify that the regular expression works as expected. You can find one by clicking on the button below.
Once this regular expression is created we match from the already reduced zfdat to read the relevant files and load the JSON data from them into a data structure called data. This data is then sorted by order of time in ascending order and returned for the next step of processing. Note that we need to add a few additional imports to handle regular expressions. Further when we setup the time range we also need to make use of the datetime library along with the pandas and JSON library. So make sure to add these to your import list.
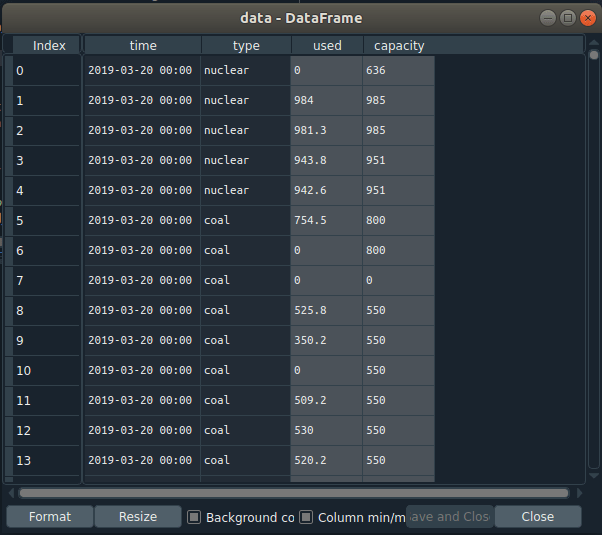
At this stage we can examine the results of our attempt to extract the data from the ZIP file. Below are the contents of the data variable I extracted from this code.
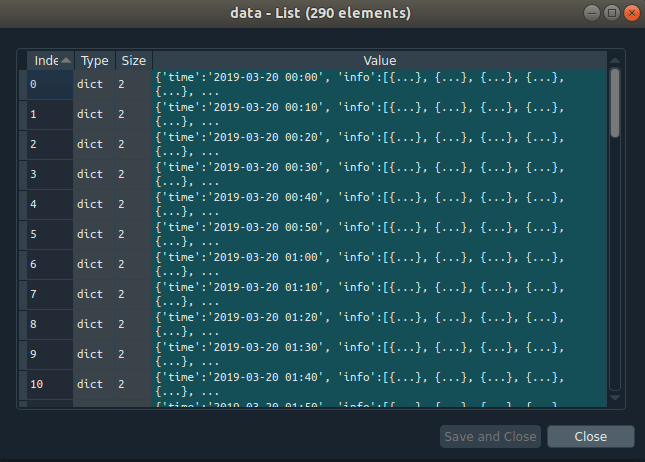
The above data structure is a list containing dictionaries. But in fact, if we look deeper its actually got more embedded information. Have a look for yourself.
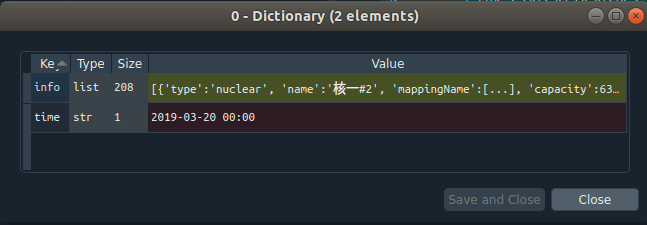
So actually we have a list of dictionaries that contain another list of dictionaries. SO going in deeper here is what we have:
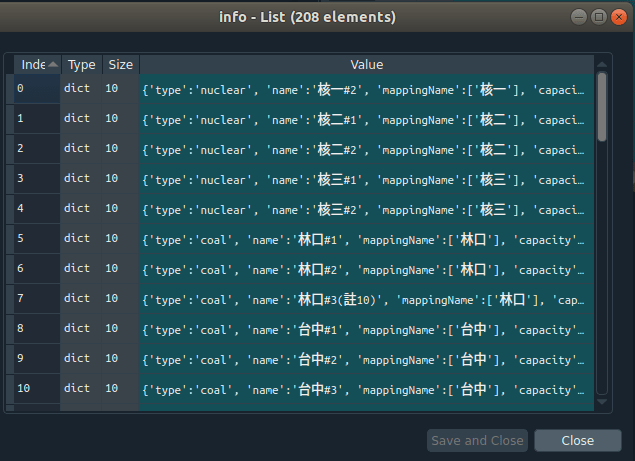
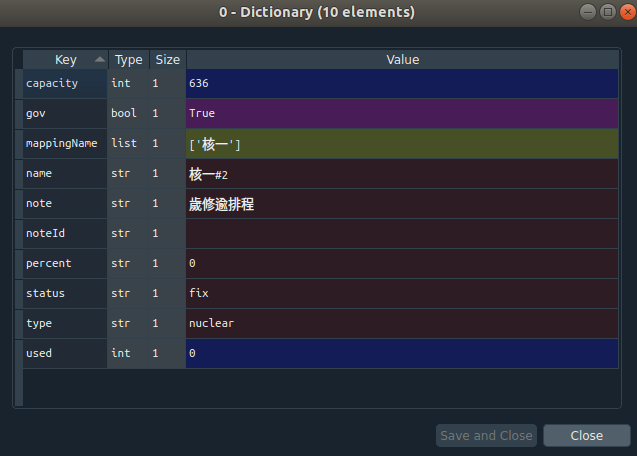
Finally this is embedded with yet another final dictionary data structure. Looking deeper at this yet again:
Basic Restructuring of Data
Now that we’ve got the basics done. Now time to be more selective. As you saw the data structure is layered one inside the other which becomes annoying to access if you are obsessive like me. The goal with this step is to put everything into a flat data structure that is only one layer deep. To do this, we’ll go back to our skeleton code and fill out the function called restructure(…). The full code is shown below.
There are a few key things happening with the code above. In line 5 we grab the data for the time period from the data structure using a LIST COMPREHENSION.
Likewise in line 9 we do the same for the info field in the original data structure.
These are the two main dictionaries inside our original list from the ZIP file. We are going to put these in a clean Pandas dataframe. We initialize this dataframe in lines 13 and 14.
Now to iterate through every unique time in our list. These unique time periods shown below. These are now stored in our variable data_time. Actually there is a lot of information from many different power plants stored in the data_info variable for each of these times. We start by iterating through each
One way to iterate is to use the enumerate function to extract both the list index and the contents of the list at that index simultaneously every iteration. Since we have a lot of different power plant generation during this one time period, we will duplicate the time list so that it is the same length as the power generation data in line 21. From this point we will also extract the power plant type, the used or generated power and the total nameplate capacity.
At this stage we can take these different bits of data and append them together into the empty dataframe we created in the data variable. Once the loop finishes its just a matter of returning the data variable.
At this stage we should have a much cleaner flat data structure that is much easier to access in the future. Looking into the variable explorer of spyder, we should see the data structure looking a bit like this:
Power Related Calculations
At this stage, lets go on and do a few simple calculations on the power data. Since we have a pretty wide range of power plant types for a given time, one thing we can do is to sum the data associated with each category of power plant that we are interested in. Earlier in the main function, we had passed in some parameters for nuclear and wind power plants. See below:
So we arrive at a total amount of power generated for nuclear and wind combined for each time in the time range that we selected. We will fill out the function called calculate that we created in our skeleton code. See below for the code for this function.
Again we start by creating an empty dataframe for the information that we are interested in. See line 7. We also grab the unique time data from our original data as passed in from the restructure function.
From here we can grab the subset of the plant types that are from the list that we passed through our main function as shown in line 16. We create a set of all power plant types and take its intersection with the list that we passed. In the case that we have an empty list, assume that we are getting all the different types of power plants.
Now iterate through for every unique time as shown below. In line 25 our goal is to use the dataframe loc function to extract only the time data that is the same as the current unique time period we are looking at. Further we want to also only get the subset of data that is in our list of power plant types pt. From here in line 30 we do a simple summing of the generated power and total capacity from the plants of the given type. This is stored into our empty dataframe by concatenating it in line 36.
The last step in this process is to return the reduced data as a dataframe for the final step, the visualization process.
Visualizing The Data
To start with visualization we will do something very simple which is to build a matlib line graph. For this we need to import the library.
Now lets create the final function in our skeleton code: The visualize function. I want to keep this function very simple for the moment so the visualization may not be that satisfying.
This function essentially just sets up the graph limits, titles, axes and plots them using a simple line graph to produce the result shown below.
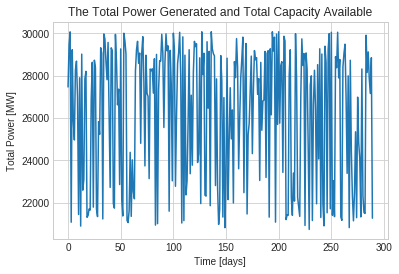
This visualization doesn’t tell us much about the Taiwan power system. But for now this article is getting really really long. So I’ll you to experiment. In a future blog I’ll explore much more interesting visualizations of the Taiwan power system and some of the things we can learn about renewables and their adoption here. More than that, I’ll discuss some of the interesting patterns of generation and consumption we can see here in Taiwan on a day to day and week to week basis.
Conclusion & Downloads
So now that you know roughly how to get started with Taiwan power data and where to get this data. Here is some of the source code and a small data set I have available for you to play with and try some of your own coding. Download below! Make sure to put it all in the same folder. Then click run in spyder and it should automatically run.